Methods of Analysis: 1. Physical and Physicochemical Methods: 1.14.1 Chromatography
This text is based on the internationally-harmonized text developed by the Pharmacopoeial Discussion Group (PDG). It has been developed and amended in line with the style and requirements of The International Pharmacopoeia (the amended text was included in black triangles ►◄).
Content:
1. Introduction
2. Definitions
3. System suitability
4. Adjustment of chromatographic conditions
5. Quantitation
6. Other Considerations
1. Introduction
Chromatographic separation techniques are multi-stage separation procedures in which the components of a sample are distributed between two phases, one of which is stationary whilst the other is mobile. The stationary phase may be a solid or a liquid supported on a solid or a gel. The stationary phase may be packed in a column, spread as a layer or distributed as a film. The mobile phase may be gaseous or liquid. The separation may be based on adsorption, mass distribution (partition), ion exchange or may be based on differences in the physico-chemical properties of the molecules such as size, mass, volume, or others.
This chapter contains definitions and calculations of common parameters and generally applicable requirements for system suitability. The principles of separation, apparatus and methods are given in the corresponding general chapters.
2. Definitions
The system suitability and acceptance criteria in monographs have been set using parameters as defined below. With some equipment, certain parameters, such as the signal-to-noise ratio and resolution, can be calculated using software provided by the manufacturer. It is the responsibility of the user to ensure that the calculation methods used in the software are equivalent to the requirements of The International Pharmacopoeia and to make any necessary corrections if this is not the case.
Chromatogram
A graphical or other representation of detector response, effluent concentration or other quantity used as a measure of effluent concentration, versus time or volume. Idealised chromatograms are represented as a sequence of Gaussian peaks on a baseline (Figure 1).
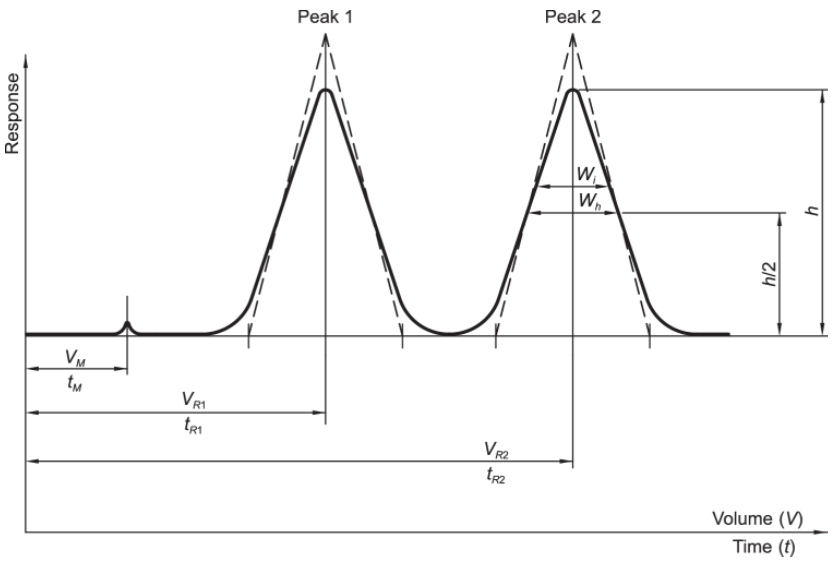
Figure 1
VM = hold-up volume
tM = hold-up time
VR1 = retention volume of peak 1
tR1 = retention time of peak 1
VR2 = retention volume of peak 2
tR2 = retention time of peak 2
Wh = peak width at half-height
Wi = peak width at the inflexion point
h = height of the peak
h/2 = half-height of the peak
Distribution constant (K0)
In size-exclusion chromatography, the elution characteristics of a component in a particular column may be given by the distribution constant (also referred to as distribution coefficient) which is calculated using the following equation:
tR = retention time
t0 = retention time of an unretained compound
tt = total mobile phase time
Dwell volume (D) (also referred to as VD)
The dwell volume (also known as gradient delay volume) is the volume between the point at which the eluents meet and the inlet of the column. It can be determined using the following procedure:
Column: replace the chromatographic column by an appropriate capillary tubing (e.g. 1 m × 0.12 mm).
Mobile phase:
-
mobile phase A: water
-
mobile phase B: 0.1 per cent (V/V) solution of acetone R in water R
|
Time (min) |
Mobile phase A (per cent V/V) |
Mobile phase B (per cent V/V) |
|
0 – 20 |
100 → 0 |
0 → 100 |
|
20 - 30 |
0 |
100 |
Flow rate: set to obtain sufficient back-pressure (e.g. 2 mL/min).
Detection: spectrophotometer at 265 nm.
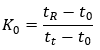
Determine the time (t0.5) in minutes when the absorbance has increased by 50 per cent (see Figure 2).

tD = t0.5 − 0.5tG, in minutes
tG = pre-defined gradient time (= 20 min)
F = flow rate, in millilitres per minute
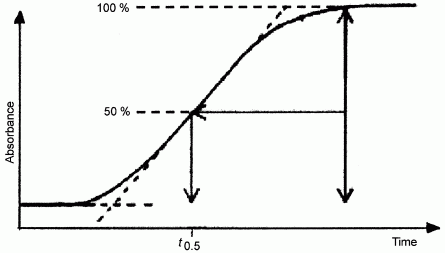
Figure 2
Note: where applicable, this measurement is performed with the autosampler in the inject position so as to include the injection loop volume in the dwell volume.
Hold-up time (tM)
Time required for elution of an unretained component (Figure 1, baseline scale being in minutes or seconds).
In size-exclusion chromatography, the term retention time of an unretained compound (t0) is used.
Hold-up volume (VM)
The volume of the mobile phase required for elution of an unretained component. It may be calculated from the hold-up time and the flow rate (F) in millilitres per minute using the following equation:
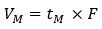
In size-exclusion chromatography, the term retention volume of an unretained compound (V0) is used.
Peak
The portion of a chromatogram recording the detector response when a single component (or 2 or more unresolved components) is eluted from the column.
The peak response may be represented by the peak area or the peak height (h).
Peak-to-valley ratio (p/v)
The peak-to-valley ratio may be employed as a system suitability criterion when the baseline separation between two peaks is not achieved (Figure 3).
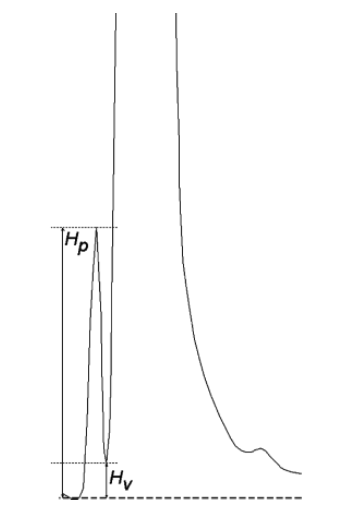
Figure 3

Hp = height above the extrapolated baseline of the minor peak
Hv = height above the extrapolated baseline at the lowest point of the curve separating the minor and major peaks
Plate height (H) (synonym: height equivalent to one theoretical plate {HETP})
Ratio of the column length (L), in micrometers, to the plate number (N):

Plate number (N) (synonym: number of theoretical plates)
A number indicative of column performance (column efficiency). It can only be calculated from data obtained under either isothermal, isocratic or isodense conditions - depending on the technique - as the plate number, using the following equation, the values of tR and wh being expressed in the same units:
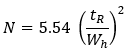
tR = retention time of the peak corresponding to the component
wh = peak width at half-height (h/2)
The plate number varies with the component as well as with the column, the column temperature, the mobile phase and the retention time.
Reduced plate height (h)
The ratio of the plate height (H), in micrometers, to the particle diameter (dp) in micrometers:

Relative retardation (R rel)
The relative retardation, used in thin-layer chromatography, is calculated as the ratio of the distances travelled by the spot of the compound of interest and a reference compound (Figure 4).
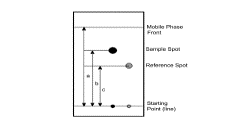
R rel = b/c
Figure 4
a = migration distance of the mobile phase
b = migration distance of the compound of interest
c = migration distance of the reference compound
Relative retention (r)
The relative retention is calculated as an estimate using the following equation:
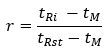
tRi = retention time of the peak of interest
tRst = retention time of the reference peak (usually the peak corresponding to the substance to be examined)
tM = hold-up time
Relative retention, unadjusted (rG ) or RRT
Unadjusted relative retention is calculated using the following equation:

Unless otherwise indicated, the values for relative retention stated in monographs correspond to unadjusted relative retention.
Relative retention time (RRT): see Relative retention, unadjusted.
Resolution (Rs)
The resolution between peaks of 2 components (Figure 1) may be calculated using the following equation:
tR2 > tR1
tR1, tR2 = retention times of the peaks
wh1, wh2 = peak widths at half-height
In quantitative thin-layer chromatography, using densitometry, the migration distances are used instead of retention times and the resolution between peaks of 2 components may be calculated using the following equation:
RF2 > RF1
RF1, RF2 = retardation factors of the peaks
wh1, wh2 = peak widths at half-height
a = migration distance of the solvent front
Retardation factor (RF)
The retardation factor, used in thin-layer chromatography, is the ratio of the distance from the point of application to the centre of the spot and the distance simultaneously travelled by the solvent front from the point of application (Figure 4).

b = migration distance of the compound of interest
a = migration distance of the solvent front
Retention factor (k)
The retention factor (also known as mass distribution ratio (Dm) or capacity factor (k′)) is defined as:
KC = distribution constant (also known as equilibrium distribution coefficient)
VS = volume of the stationary phase
VM = volume of the mobile phase
The retention factor of a component may be determined from the chromatogram using the following equation:

tR = retention time
tM = hold-up time
Retention time (tR)
The time elapsed between the injection of the sample and the appearance of the maximum peak response of the eluted sample zone (Figure 1, baseline scale being in minutes or seconds).
Retention volume (VR)
The volume of the mobile phase required for elution of a compound. It may be calculated from the retention time (tR) and the flow rate (F) in millilitres per minute using the following equation:

Retention time of an unretained compound (t0)
In size-exclusion chromatography, the retention time of a component whose molecules are larger than the largest gel pores (Figure 5).
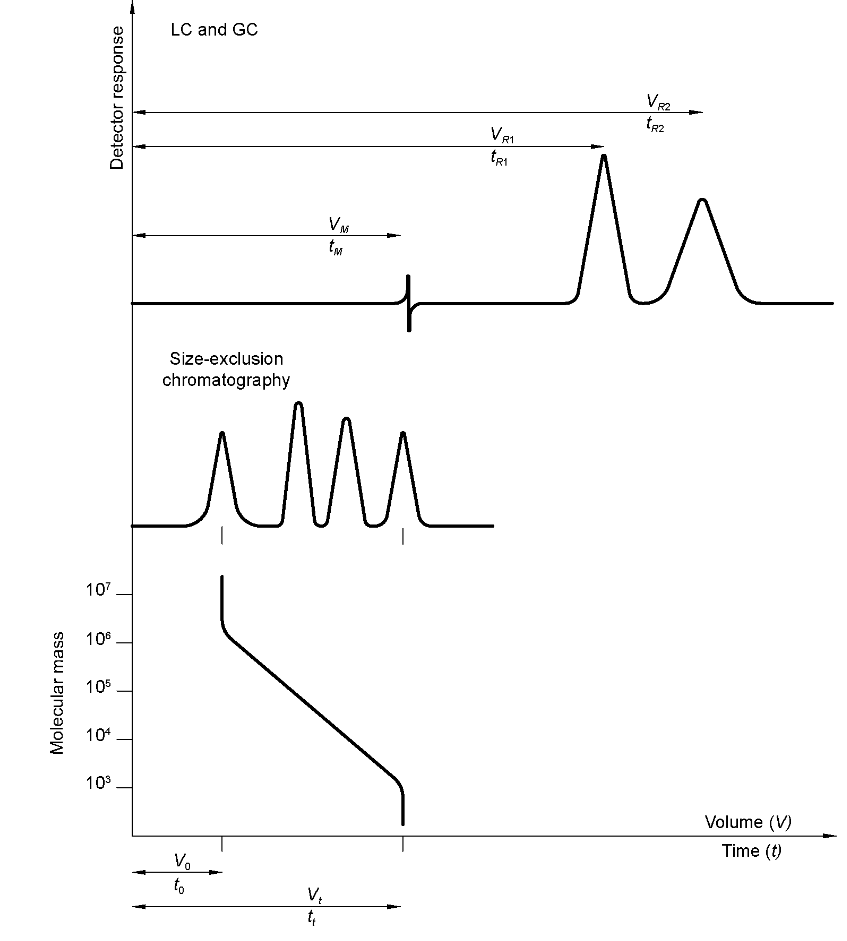
Figure 5
Retention volume of an unretained compound (V0)
In size-exclusion chromatography, the retention volume of a component whose molecules are larger than the largest gel pores. It may be calculated from the retention time of an unretained compound (t0) and the flow rate (F) in millilitres per minute using the following equation:

Separation factor (α)
The relative retention calculated for two adjacent peaks (by convention, the value of the separation factor is always > 1):
α = k2/k1
k1 = retention factor of the first peak
k2 = retention factor of the second peak
Signal-to-noise ratio (S/N)
The short-term noise influences the precision and accuracy of quantitation. The signal-to-noise ratio is calculated using the following equation:

|
H |
= |
height of the peak (Figure 6) corresponding to the component concerned, in the chromatogram obtained with the prescribed reference solution, measured from the maximum of the peak to the extrapolated baseline of the signal observed over a distance equal to 5 times the width at half-height |
|
h |
= |
range of the noise in a chromatogram obtained after injection of a blank (Figure 7), observed over a distance equal to 20 times the width at half-height of the peak in the chromatogram obtained with the prescribed reference solution and, if possible, situated equally around the place where this peak would be found |
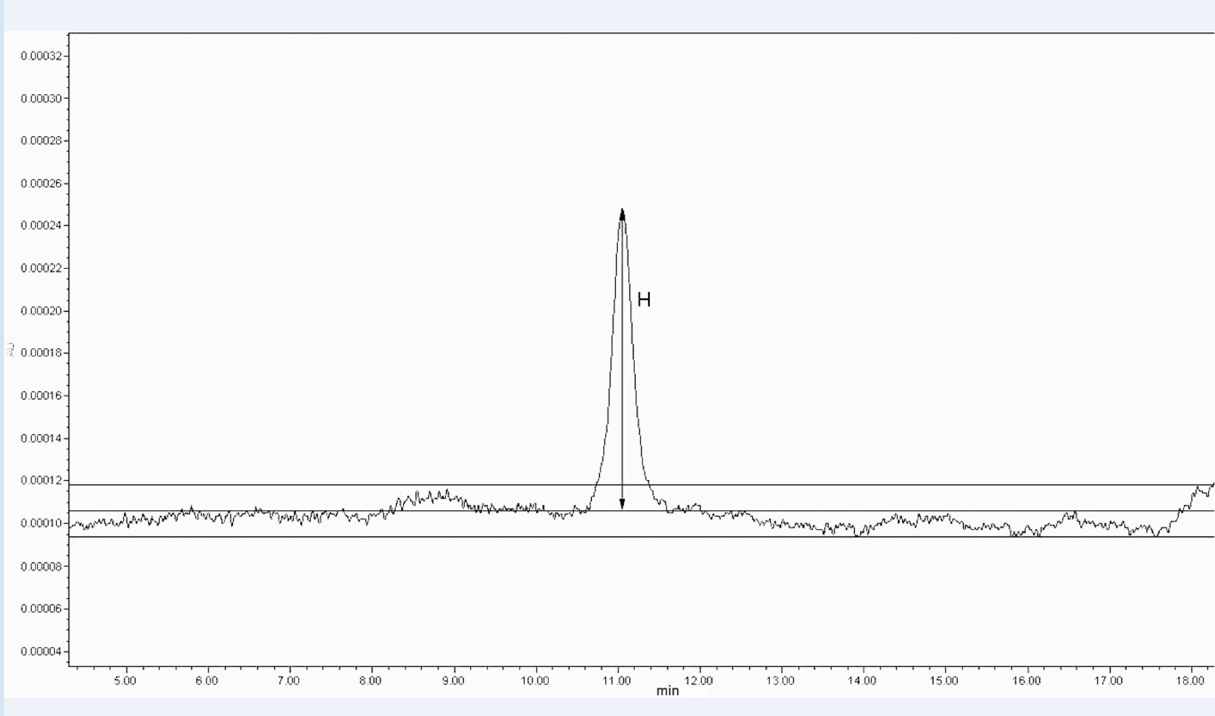
Figure 6. Chromatogram of the reference solution
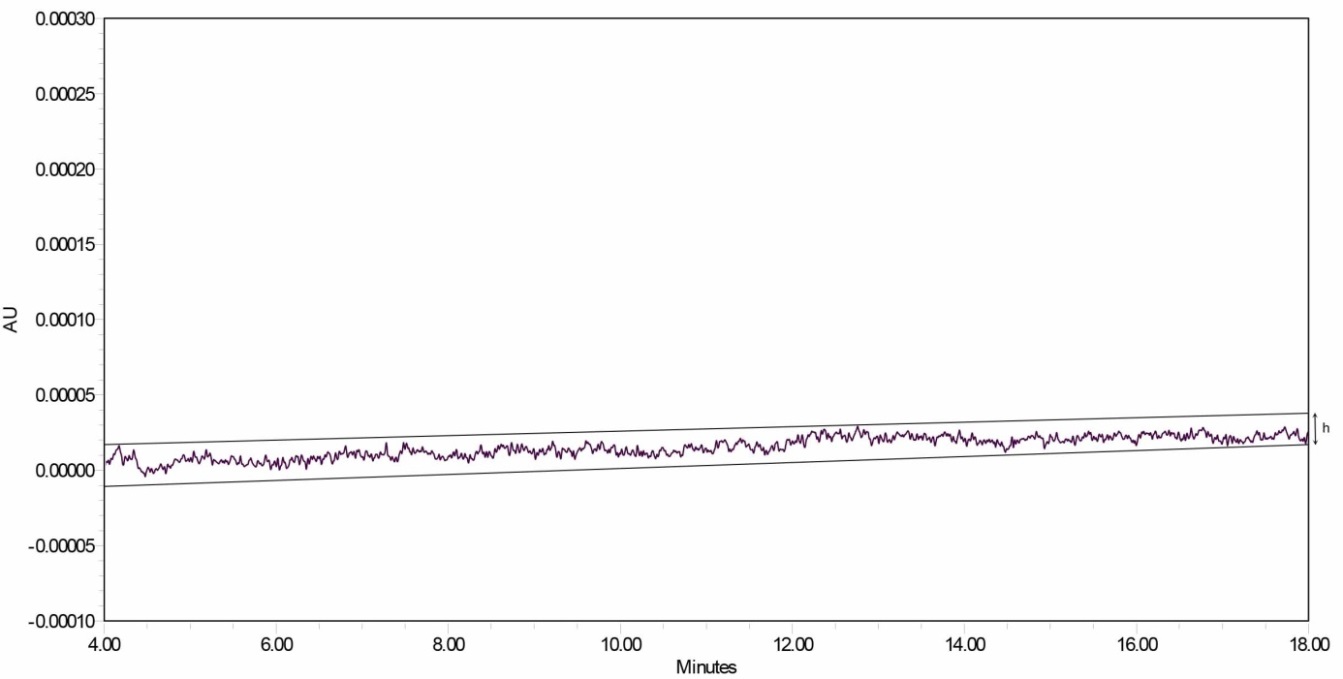
Figure 7. Chromatogram of a blank
Symmetry factor (As)
The symmetry factor of a peak (also known as the asymmetry factor or tailing factor) (Figure 8) is calculated using the following equation:

w0.05 = width of the peak at one-twentieth of the peak height
d = distance between the perpendicular dropped from the peak maximum and the leading edge of the peak at one-twentieth of the peak height
An As value of 1.0 signifies symmetry. When As > 1.0, the peak is tailing. When As < 1.0, the peak is fronting.
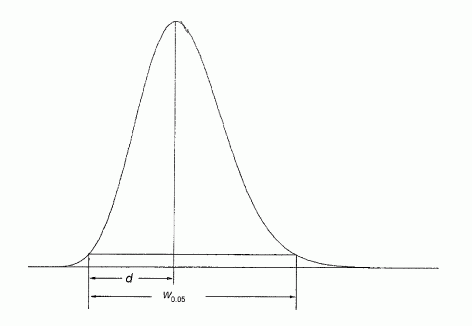
Figure 8
System repeatability
The repeatability of response is expressed as an estimated percentage relative standard deviation (%RSD) of a consecutive series of measurements for not fewer than 3 injections or applications of a reference solution, and is calculated using the following equation:
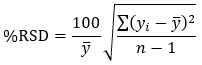
 = individual values expressed as peak area, peak height or ratio of areas by the internal standardisation method
 = mean of individual values
n = number of individual values
Total mobile phase time (tt)
In size-exclusion chromatography, the retention time of a component whose molecules are smaller than the smallest gel pores (Figure 5).
Total mobile phase volume (Vt)
In size-exclusion chromatography, the retention volume of a component whose molecules are smaller than the smallest gel pores. It may be calculated from the total mobile phase time and the flow rate (F) in millilitres per minute using the following equation:

3. System suitability
This section only covers liquid chromatography and gas chromatography.
The various components of the equipment employed must be qualified and capable of achieving the performance required to conduct the test or assay.
The system suitability tests represent an integral part of the analytical procedure and are used to ensure the adequate performance of the chromatographic system. The column plate number, retention factor (mass distribution ratio), system repeatability, signal-to-noise, symmetry factor and resolution/peak-to-valley ratio are the parameters that may be employed in assessing the performance of the chromatographic system. When stated in the individual monograph, in cases of complex chromatographic profiles (e.g. for biotechnological/biological products), visual comparison of the profiles can be used as a system suitability test.
Factors that may affect the chromatographic behaviour include:
-
composition and temperature of the mobile phase;
-
ionic strength and pH of the aqueous component of the mobile phase;
-
flow rate, column dimensions, column temperature and pressure;
-
stationary phase characteristics, including type of chromatographic support (particle-based or monolithic), particle or pore size, porosity and specific surface area; and
-
reversed phase and other surface-modification of the stationary phases, the extent of chemical modification (as expressed by end-capping, carbon loading, etc.).
Retention times and relative retentions may be provided in monographs for information purposes only, unless otherwise stated in the monograph. There are no acceptance criteria applied to relative retentions.
Compliance with the system suitability criteria is required throughout the chromatographic procedure. No sample analysis is acceptable unless the suitability of the system has been demonstrated.
The following requirements are to be fulfilled, in addition to any other system suitability criteria stated in the monograph. When specific requirements are stated in the monograph, they supersede the requirements mentioned in this chapter:
System repeatability – assay of an active substance or an excipient
In an assay of an active substance or an excipient, where the target value is 100 per cent for a pure substance, and a system repeatability requirement is not specified, the maximum permitted relative standard deviation (%RSDmax) for the defined limits is calculated for a series (n = 3 to 6) of injections of the reference solution. The maximum permitted relative standard deviation of the peak response does not exceed the appropriate value given in Table 1.
K = constant (0.349), obtained from the expression:
in which  represents the required percentage relative standard deviation determined on 6 injections for B = 1.0
B = upper limit given in the definition of the individual monograph minus 100 per cent
n = number of replicate injections of the reference solution (3 ≤ n ≤ 6)
t90%,n-1 = Student's t at the 90 per cent probability level (double sided) with n−1 degrees of freedom
Table 1 – Maximum permitted relative standard deviation (assay)
|
Number of individual injections n |
||||
|
3 |
4 |
5 |
6 |
|
|
B (per cent) |
Maximum permitted relative standard deviation (per cent) |
|||
|
2.0 |
0.41 |
0.59 |
0.73 |
0.85 |
|
2.5 |
0.52 |
0.74 |
0.92 |
1.06 |
|
3.0 |
0.62 |
0.89 |
1.10 |
1.27 |
B = upper limit of content given in the individual monograph minus 100 per cent
System sensitivity
The signal-to-noise ratio is used to define the system sensitivity. The limit of quantitation (corresponding to a signal-to-noise ratio of 10) is equal to or less than the reporting threshold.
Peak symmetry
Unless otherwise stated, in a test or assay, the symmetry factor (tailing factor) of the peak used for quantitation is 0.8 to 1.8.
4. Adjustment of chromatographic conditions
The chromatographic conditions described have been validated during the elaboration of the monograph.
The extent to which the various parameters of a chromatographic test may be adjusted without fundamentally modifying the pharmacopoeial analytical procedures are listed below. Changes other than those indicated require revalidation of the procedure.
Multiple adjustments can have a cumulative effect on the performance of the system and are to be properly evaluated by the users. This is particularly important in cases where the separation pattern is described as a profile. In those cases, a risk assessment has to be carried out.
Any adjustments must be made on the basis of the pharmacopoeial procedure.
If adjustments are made to a pharmacopoeial procedure, additional verification tests may be required. To verify the suitability of the adjusted pharmacopoeial procedure, assess the relevant analytical performance characteristics potentially affected by the change.
When a pharmacopoeial analytical procedure has been adjusted according to the requirements stated below, no further adjustments are allowed without appropriate revalidation.
Compliance with the system suitability criteria is required to verify that conditions for satisfactory performance of the test or assay are achieved.
The adjustment of conditions with gradient elution (HPLC) or temperature programming (GC) is more critical than with isocratic (HPLC) or isothermal (GC) elution since it may shift some peaks to a different step of the gradient or to different elution temperatures, potentially causing partial or complete coelution of adjacent peaks or peak inversion, and thus leading to the incorrect assignment of peaks and to the masking of peaks or a shift such that elution occurs beyond the prescribed elution time.
For some parameters, the adjustments are explicitly defined in the monograph to ensure the system suitability.
Thin-layer chromatography
Composition of the mobile phase: the amount of the minor solvent components may be adjusted by ± 30 per cent relative or ± 2 per cent absolute, whichever is the larger; no other component is altered by more than 10 per cent absolute. A minor component comprises less than or equal to (100/n) per cent, n being the total number of components of the mobile phase. For a minor component at 10 per cent of the mobile phase, a 30 per cent relative adjustment allows a range of 7-13 per cent whereas a 2 per cent absolute adjustment allows a range of 8-12 per cent, the relative value therefore being the larger; for a minor component at 5 per cent of the mobile phase, a 30 per cent relative adjustment allows a range of 3.5-6.5 per cent whereas a 2 per cent absolute adjustment allows a range of 3-7 per cent, the absolute value being the larger in this case.
pH of the aqueous component of the mobile phase: ± 0.2 pH units, unless otherwise prescribed.
Concentration of salts in the buffer component of a mobile phase: ± 10 per cent.
Application volume: 10-20 per cent of the prescribed volume if using fine particle size plates (2-10 µm).
Liquid chromatography: isocratic elution
Column parameters and flow rate
- Stationary phase: no change of the identity of the substituent (e.g. no replacement of C18 by C8); the other physico-chemical characteristics of the stationary phase (i.e. chromatographic support, surface modification and extent of chemical modification must be similar); a change from Totally Porous Particle (TPP) columns to Superficially Porous Particle (SPP) columns is allowed provided the above-mentioned requirements are met.
- Column dimensions (particle size, length): the particle size and/or length of the column may be modified provided that the ratio of the column length (L) to the particle size (dp) remains constant or in the range between − 25 per cent to + 50 per cent of the prescribed L/dp ratio.
- Adjustments from totally porous to superficially porous particles : for the application of particle-size adjustment from totally porous to superficially porous particles, other combinations of L and dp can be used provided that the plate number (N) is within – 25 per cent to + 50 per cent, relative to the prescribed column. These changes are acceptable provided the system suitability criteria are fulfilled, and selectivity and elution order of the specified impurities to be controlled are demonstrated to be equivalent.
- Internal diameter: in absence of a change in particle size and/or length, the internal diameter of the column may be adjusted.
Caution is necessary when the adjustment results in smaller peak volumes, due to a smaller particle size or a smaller internal diameter, a situation which may require adjustments to minimize extra-column band broadening by factors such as instrument connections, detector cell volume and sampling rate, and injection volume.
When the particle size is changed, the flow rate requires adjustment because smaller-particle columns will require higher linear velocities for the same performance (as measured by reduced plate height). The flow rate is adjusted for both the change in column diameter and particle size using the following equation:
F2 = F1 × [(dc22 × dp1)/(dc12 × dp2)]
F1 = flow rate indicated in the monograph, in millilitres per minute
F2 = adjusted flow rate, in millilitres per minute
dc1 = internal diameter of the column indicated in the monograph, in millimetres
dc2 = internal diameter of the column used, in millimetres
dp1 = particle size indicated in the monograph, in micrometres
dp2 = particle size of the column used, in micrometres
When a change is made from ≥ 3-µm to < 3-µm particles in isocratic separations, an additional increase in linear velocity (by adjusting the flow rate) may be justified, provided that the column performance does not drop by more than 20 per cent. Similarly, when a change is made from < 3-µm to ≥ 3-µm particles, an additional reduction of linear velocity (flow rate) may be justified to avoid reduction in column performance by more than 20 per cent.
After an adjustment due to a change in column dimensions, an additional change in flow rate of ± 50 per cent is permitted.
-
Column temperature: ± 10 °C, where the operating temperature is specified, unless otherwise prescribed.
Further adjustments in analytical procedure conditions (mobile phase, temperature, pH, etc.) may be required, within the permitted ranges described under System Suitability and Adjustment of chromatographic conditions in this chapter.
Mobile phase
- Composition: the amount of the minor solvent components may be adjusted by ± 30 per cent relative (see examples under Thin-layer chromatography); no component is altered by more than 10 per cent absolute. A minor component comprises less than or equal to (100/n) per cent, n being the total number of components of the mobile phase.
- pH of the aqueous component of the mobile phase: ± 0.2 pH units, unless otherwise prescribed.
- Concentration of salts in the buffer component of a mobile phase: ± 10 per cent.
- Flow rate: in absence of a change in column dimensions, an adjustment of the flow rate by ± 50 per cent is permitted.
Detector wavelength
No adjustment permitted.
Injection volume
When the column dimensions are changed, the following equation may be used for adjusting the injection volume:
Vinj2 = Vinj1 (L2 dc22) / (L1 dc12)
Vinj1 = injection volume indicated in the monograph, in microlitres
Vinj2 = adjusted injection volume, in microlitres
L1 = column length indicated in the monograph, in millimetres
L2 = new column length, in millimetres
dc1 = column internal diameter indicated in the monograph, in millimetres
dc2 = new column internal diameter, in millimetres
This equation may not be applicable to changes from TPP columns to SPP columns.
Even in the absence of any column dimension change, the injection volume may be varied provided System Suitability criteria remain within their established acceptability limits. When the injection volume is decreased, special attention is given to (the limit of) detection and repeatability of the peak response(s) to be determined. An increase is permitted provided, in particular, the linearity and resolution of the peak(s) to be determined remain satisfactory.
Liquid chromatography: gradient elution
The adjustment of chromatographic conditions for gradient systems requires greater caution than for isocratic systems.
Column parameters and flow rate
- Stationary phase: no change of the identity of the substituent (e.g. no replacement of C18 by C8); the other physico-chemical characteristics of the stationary phase (i.e. chromatographic support, surface modification and extent of chemical modification must be similar); a change from Totally Porous Particle (TPP) columns to Superficially Porous Particle (SPP) columns is allowed provided the above-mentioned requirements are met.
- Column dimensions (particle size, length): the particle size and/or length of the column may be modified provided that the ratio of the column length (L) to the particle size (dp) remains constant or in the range between − 25 per cent to +50 per cent of the prescribed L/dp ratio.
- Adjustments from totally porous to superficially porous particles: for the application of particle-size adjustment from totally porous to superficially porous particles, other combinations of L and dp can be used provided that the ratio (tR/wh)2 is within – 25 per cent to + 50 per cent, relative to the prescribed column, for each peak used to check the system suitability, as stated in this chapter and the individual monograph. These changes are acceptable provided system suitability criteria are fulfilled, and selectivity and elution order of the specified impurities to be controlled are demonstrated to be equivalent.
- Internal diameter: in the absence of a change in particle size and/or length, the internal diameter of the column may be adjusted.
Caution is necessary when the adjustment results in smaller peak volumes due to a smaller particle size or a smaller internal diameter, a situation which may require adjustments to minimize extra-column band broadening by factors such as instrument connections, detector cell volume and sampling rate, and injection volume.
When the particle size is changed, the flow rate requires adjustment because smaller-particle columns will require higher linear velocities for the same performance (as measured by reduced plate height). The flow rate is adjusted for both the change in column diameter and particle size using the following equation:
F2 = F1 × [(dc22 × dp1)/(dc12 × dp2)]
F1 = flow rate indicated in the monograph, in millilitres per minute
F2 = adjusted flow rate, in millilitres per minute
dc1 = internal diameter of the column indicated in the monograph, in millimetres
dc2 = internal diameter of the column used, in millimetres
dp1 = particle size indicated in the monograph, in micrometres
dp2. = particle size of the column used, in micrometres
A change in column dimensions, and thus in column volume, impacts the gradient volume which controls selectivity. Gradients are adjusted to the column volume by changing the gradient volume in proportion to the column volume. This applies to every gradient segment volume. Since the gradient volume is the gradient time, tG, multiplied by the flow rate, F, the gradient time for each gradient segment needs to be adjusted to maintain a constant ratio of the gradient volume to the column volume (expressed as L x dc2). Thus, the new gradient time, tG2 can be calculated from the original gradient time, tG1, the flow rate(s) and the column dimensions as follows:
tG2 = tG1 × (F1 / F2) [(L2 × dc22) / (L1 × dc1 2)]
Thus, the change in conditions for gradient elution requires three steps:
(1) adjust the column length and particle size according to L/dp;
(2) adjust the flow rate for changes in particle size and column diameter; and
(3) adjust the gradient time of each segment for changes in column length, diameter and flow rate. The example below illustrates this process.
Table 2
|
Variable |
Original Conditions |
Adjusted Conditions |
Comment |
|
Column length (L) in mm |
150 |
100 |
User's choice |
|
Column diameter (dc) in mm |
4.6 |
2.1 |
User's choice |
|
Particle size (dp) in µm |
5 |
3 |
User's choice |
|
L /dp |
30.0 |
33.3 |
(1) |
|
Flow rate in mL/min |
2.0 |
0.7 |
(2) |
|
Gradient adjustment factor (tG2/tG1) |
0.4 |
(3) |
|
|
Gradient conditions |
|||
|
B (per cent) |
Time (min) |
Time (min) |
|
|
30 |
0 |
0 |
|
|
30 |
3 |
(3x0.4)=1.2 |
|
|
70 |
13 |
[1.2+(10x0.4)]=5.2 |
|
|
30 |
16 |
[5.2+(3x0.4)]=6.4 |
(1) 11 per cent increase within allowed L/dp change of – 25 per cent to + 50 per cent
(2) calculated using F2= F1 [(dc22 x dp1) / ( dc12 x dp2)]
(3) calculated using tG2 = tG1 x (F1 / F2) [(L2 x dc22) / (L1 x dc12)]
-
Column temperature: ± 5 °C, where the operating temperature is specified, unless otherwise prescribed.
Further adjustments in analytical procedure conditions (mobile phase, temperature, pH, etc.) may be required, within the permitted ranges described under System Suitability and Adjustment of Chromatographic Conditions in this chapter.
Mobile phase
-
Composition/gradient: adjustments of the composition of the mobile phase and the gradient are acceptable, provided that:
-
the system suitability criteria are fulfilled;
-
the principal peak(s) elute(s) within ± 15 per cent of the retention time(s) obtained with the original conditions; this requirement does not apply when the column dimensions are changed; and
-
the composition of the mobile phase and the gradient are such that the first peaks are sufficiently retained and the last peaks are eluted.
-
- pH of the aqueous component of the mobile phase: ± 0.2 pH units, unless otherwise prescribed.
- Concentration of salts in the buffer component of a mobile phase : ± 10 per cent.
Where compliance with the system suitability criteria cannot be achieved, it is often preferable to consider the dwell volume or to change the column.
Dwell volume
The configuration of the equipment ►and the type of solvent delivery system (low pressure versus high pressure mixing systems)◄ employed may significantly alter the resolution, retention time and relative retentions described. Should this occur, it may be due to a change in dwell volume. Monographs preferably include an isocratic step before the start of the gradient programme so that an adaptation can be made to the gradient time points to take account of differences in dwell volume between the system used for analytical procedure development and that actually used. It is the user's responsibility to adapt the length of the isocratic step to the analytical equipment used. If the dwell volume used during the elaboration of the monograph is given in the monograph, the time points (t min) stated in the gradient table may be replaced by adapted time points (tc min), calculated using the following equation:
D = dwell volume, in millilitres
D0 = dwell volume used for development of the analytical procedure, in millilitres
F = flow rate, in millilitres per minute
The isocratic step introduced for this purpose may be omitted if validation data for application of the analytical procedure without this step is available.
Detector wavelength
No adjustment permitted.
Injection volume
When the column dimensions are changed, the following equation may be used for adjusting the injection volume:
Vinj2 = Vinj1 (L2 dc22) / (L1 dc12)
Vinj1 = injection volume indicated in the monograph, in microlitres
Vinj2 = adjusted injection volume, in microliters
L1 = column length indicated in the monograph, in millimetres
L2 = new column length, in millimetres
d c1 = column internal diameter indicated in the monograph, in millimetres
dc2 = new column internal diameter, in millimetres
This equation may not be applicable to changes from TPP columns to SPP columns.
Even in the absence of any column dimension change, the injection volume may be varied provided system suitability criteria remain within their established acceptability limits. When the injection volume is decreased, special attention is given to (the limit of) detection and repeatability of the peak response(s) to be determined. An increase is permitted provided, in particular, the linearity and resolution of the peak(s) to be determined remain satisfactory.
Gas chromatography
Column parameters
-
Stationary phase:
-
particle size: maximum reduction of 50 per cent; no increase permitted (packed columns);
-
film thickness: − 50 per cent to + 100 per cent (capillary columns).
-
-
Column dimensions:
-
length: − 70 per cent to + 100 per cent;
-
internal diameter: ± 50 per cent.
-
-
Column temperature: ± 10 per cent.
-
Temperature programme: adjustment of temperatures is permitted as stated above; adjustment of ramp rates and hold times of up to ± 20 per cent is permitted.
Flow rate
± 50 per cent.
The above changes are acceptable provided system suitability criteria are fulfilled and selectivity and elution order of the specified impurities to be controlled are demonstrated to be equivalent.
Injection volume and split ratio
May be varied provided system suitability criteria remain within their established acceptability limits. When the injection volume is decreased, or the split ratio is increased, special attention is given to (the limit of) detection and repeatability of the peak response(s) to be determined. An increase in injection volume or a decrease in split ratio is permitted provided, in particular, the linearity and resolution of the peak(s) to be determined remain satisfactory.
Injection port temperature and transfer-line temperature in static head-space conditions
± 10 °C, provided no decomposition or condensation occurs.
5. Quantitation
The following quantitation approaches may be used in general texts or monographs:
External standard method
-
using a calibration function
Standard solutions with several graded amounts of a reference standard of the compound to be analysed are prepared in a range that has been demonstrated to give a linear response, and a fixed volume of these standard solutions is injected. With the chromatograms obtained, a calibration function is prepared by plotting the peak areas or peak heights on the ordinate against the amount of reference standard on the abscissa. The calibration function is generally obtained by linear regression. Then, a sample solution is prepared according to the procedure specified in the individual monograph. The chromatography is performed under the same operating conditions as for the preparation of the calibration function, the peak area or peak height of the compound to be analysed is measured, and the amount of the compound is read out or calculated from the calibration function.
-
using one-point calibration
In an individual monograph, generally one of the standard solutions with a concentration within the linear range of the calibration function and a sample solution with a concentration close to that of the standard solution are prepared, and the chromatography is performed under fixed conditions to obtain the amount of the compound by comparing the responses obtained. In this method, all procedures, such as the injection, must be carried out under constant conditions.
Internal standard method
-
using a calibration function
In the internal standard method, a stable compound is chosen as an internal standard which shows a retention time close to that of the compound to be analysed, and whose peak is well separated from all other peaks in the chromatogram. Several standard solutions containing a fixed amount of the internal standard and graded amounts of a reference standard of the compound to be analysed are prepared. Based on the chromatograms obtained by injection of a fixed volume of individual standard solutions, the ratio of peak area or peak height of the reference standard to that of the internal standard is calculated. A calibration function by plotting these ratios on the ordinate against the amount of the reference standard or the ratio of the amount of reference standard to that of the internal standard on the abscissa is prepared. The calibration function is generally obtained by linear regression. Then, a sample solution containing the internal standard in the same amount as in the standard solutions used for the preparation of the calibration function is prepared according to the procedure specified in the individual monograph. The chromatography is performed under the same operating conditions as for the preparation of the calibration function. The ratio of the peak area or peak height of the compound to be analysed to that of the internal standard is calculated, and the amount of the compound is read out or calculated from the calibration function.
-
using one point calibration
In an individual monograph, generally one of the standard solutions with a concentration within the linear range of the calibration function and a sample solution with a concentration close to that of the standard solution, both containing a fixed amount of the internal standard, are prepared, and the chromatography is performed under fixed conditions to determine the amount of the compound to be analysed by comparing the ratios obtained.
Normalisation procedure
Provided linearity of the peaks has been demonstrated, individual monographs may prescribe that the percentage content of a component of the substance to be examined is calculated by determining the area of the corresponding peak as a percentage of the total area of all the peaks, excluding those due to solvents or reagents or arising from the mobile phase or the sample matrix, and those at or below the disregard limit or reporting threshold.
6. Other considerations
Detector response
The detector sensitivity is the signal output per unit concentration or unit mass of a substance in the mobile phase entering the detector. The relative detector response factor, commonly referred to as response factor, expresses the sensitivity of a detector for a given substance relative to a standard substance. The correction factor is the reciprocal of the response factor.
In tests for related substances, any correction factors indicated in the monograph are applied (i.e. when the response factor is outside the range 0.8-1.2).
Interfering peaks
Peaks due to solvents and reagents or arising from the mobile phase or the sample matrix are disregarded.
Measurement of peaks
Integration of the peak area of any impurity that is not completely separated from the principal peak is preferably performed by tangential skim (Figure 9).
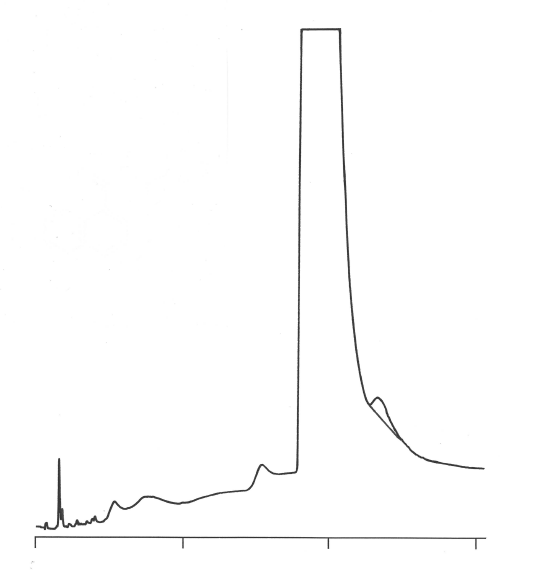
Figure 9
Reporting threshold.
When the related substances test prescribes a limit for the total of impurities or a quantitative determination of an impurity, it is important to choose an appropriate reporting threshold and appropriate conditions for the integration of the peak areas.
In such tests, the reporting threshold (i.e. the limit above which a peak is reported) is generally 0.05 per cent.