Methods of Analysis: 1. Physical and Physicochemical Methods: 1.16 Phase solubility analysis
Phase solubility analysis is a technique for quantitatively determining the purity of a substance through the application of precise solubility measurements. At a given temperature, a definite amount of a pure substance is soluble in a definite quantity of solvent. The resulting solution is saturated in respect of the particular substance, but the solution remains unsaturated in respect of other substances even though such substances may be closely related in chemical structure and physical properties to the particular substance being tested. Constancy of solubility indicates that a material is pure or free from foreign substances except in the unique case where the percentage composition of the material being tested is in direct ratio to the solubilities of the respective components. Conversely, variability of solubility indicates the presence of an impurity or impurities.
The standard solubility method consists of several distinct steps: (a) preparation of a series of separate systems composed of increasing quantities of material and measured, constant amounts of solvent; (b) establishment of equilibrium for each system at identical constant temperature and pressure; (c) separation of the solid phase from the solutions; (d) determination of the concentration of the material dissolved in the various solutions; (e) graphical representation of the ratio of the weight of the dissolved materials per weight of solvent against the ratio of the total weight of material per weight of solvent, extrapolation and calculation. Alternatively, statistical procedures may be used to evaluate the purity of the test substance from the data obtained.
Solvents
The following criteria are used in the selection of a proper solvent for phase solubility analysis:
(1) The solvent should be of such volatility that it can be evaporated under vacuum, but it should not be so volatile that difficulty is experienced in transferring and weighing the solvent and its solutions. Normally, solvents with boiling points between 60 °C and 150 °C are suitable.
(2) The solvent should not adversely affect the substance. Solvents that cause decomposition or react with the substance cannot be used. Solvents that solvate or form salts should be avoided if possible.
(3) The solvent should be of known purity and composition. Mixed solvents are permissible. Trace impurities may affect solubility greatly.
(4) For the method described below the test substance should be soluble to the extent of not less than 4 mg/g and not more than 50 mg/g in the solvent chosen. A solubility of 10-20 mg/g is optimal.
Apparatus
Constant-temperature bath. For these tests use a constant-temperature bath capable of maintaining a preselected temperature within ± 0.1 °C. Normally temperatures of 25 °C or 30 °C are selected. The bath should be equipped with a horizontal shaft capable of rotating at approximately 25 revolutions per minute, equipped with clamps to hold ampoules. Alternatively the bath may contain a suitable vibrator, capable of vibrating at 100-120 vibrations per second, equipped with a shaft with suitable clamps to hold the ampoules, or other suitable device to achieve equilibrium in the ampoules.
Ampoules. Use 15-mL ampoules similar to that shown in Fig. 2. Other containers may be used provided that they are leakproof and are suitable in all other respects.
FIG. 2. AMPOULE (LEFT) AND SOLUBILITY FLASK (RIGHT)
USED IN PHASE SOLUBILITY ANALYSIS
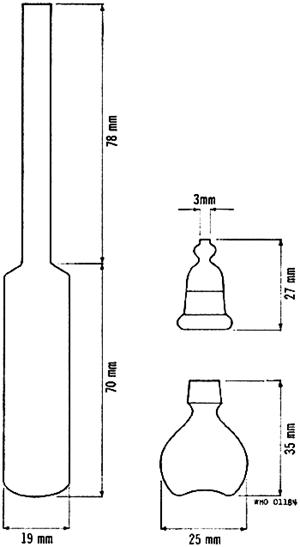
Solubility flasks. Use solubility flasks suitable for freeze-drying. A suitable flask (with stopper) is shown in Fig. 2.
Balance. Use a suitable balance and technique to ensure that all weighings are within ± 10 μg.
Recommended procedure
The method described below is generally applicable. However, in certain cases other conditions (volume of solvent, etc.) than those specified here might be preferable.
System composition
Weigh accurately not less than 7 marked, scrupulously cleaned, ampoules and into each of them weigh, accurately, increasingly larger amounts of the test substance. The weight of the test substance is selected so that the first ampoule contains slightly less material than will go into solution in 5 mL of the selected solvent, and the second ampoule and subsequent ampoules slightly more than the indicated solubility. Pipette 5.0 mL of the solvent into each of the ampoules, cool in a dry-ice/acetone mixture, and seal, using a double-jet air-gas burner and taking care to save all the fragments of glass. Allow the ampoules and their contents to come to room temperature, and weigh the individual sealed ampoules plus any corresponding glass fragments. Calculate the system composition, in mg of substance per g of solvent, for each ampoule by the formula 1000 (W2 - W1)/(W3 - W2), in which W1 is the weight of the empty ampoule, W2 is the weight of the ampoule plus test substance, and W3 is the weight of the ampoule plus test substance, solvent and separated glass.
Equilibration
The time required for equilibration varies with the substance, the method of mixing (vibration or rotation) and the temperature. Normally equilibrium is obtained more rapidly by the vibration method (1-7 days) than by the rotational method (7-14 days).
In order to demonstrate that a state of equilibrium has been attained, the following procedure is frequently applicable: Bring about a supersaturated solution in one of the ampoules - the next to the last in the series - by warming it to a temperature about 10 °C above that of the constant-temperature bath, taking care that not all the solid in the ampoule is dissolved. Thereafter, treat this ampoule in exactly the same manner as the other ampoules. If the solubility value obtained from it plots out in line with the other values, it indicates that all the ampoules have attained equilibrium. However, failure of the solubility value from the "supersaturated" ampoule to fall in line with the other solubility values does not necessarily prove that the other ampoules have not attained equilibrium, since it can occasionally be due to the tendency of certain materials to remain in supersaturated solution. To attain equilibrium in such cases, run a series of phase solubility analyses applying different equilibration times so as to make certain that constant values for the slope of the solubility curve have been achieved.
Solution composition
After equilibration, place the ampoules vertically in a rack in the constant-temperature bath, with their necks above the water level, and allow the contents to settle. Taking full precautions to minimize solvent evaporation, open the ampoules, and remove a volume of 2.0 mL from each by means of a pipette equipped with a small pledget of cotton-wool or with other suitable means of serving as a filter. Remove the cotton-wool, transfer the aliquot of clear solution from each ampoule to a marked, tared solubility flask, and weigh each flask plus its solution to obtain the weight of the solution. Cool the flasks in a dry-ice/acetone bath, and then evaporate the solvent in a vacuum. Gradually increase the temperature from 70 to 100 °C, and dry the residue to constant weight. Calculate the solution composition, in mg of substance per g of solvent, by the formula 1000 (F3 - Fl)/(F2 - F3), in which Fl is the weight of the solubility flask, F2 is the weight of the flask plus solution, and F3 is the weight of the flask plus residue.
Calculation
Prepare a graphical representation of the results for each portion of the test substance taken by plotting the ratio of the weight of the dissolved materials per weight of solvent (Y axis or solution composition) against the ratio of the total weight of material per weight of solvent (X axis or system composition). As shown in Fig. 3, the points for those containers that represent a true solution should approach a straight line (AB) with a slope of 1, passing through the origin; the points corresponding to saturated solutions should approach another straight line (BC), the slope, S, of which represents the fraction of total impurities present in the test substance. Failure of points to approach a straight line usually indicates that equilibrium has not been achieved although this may also be due to formation of a solid solution or departure from ideal behaviour. Calculate the percentage purity of the test substance by the formula 100 - 100S. The slope may be calculated by the equation S = (Y2 - Y1)/(X2 - X1) in which Y2 and Y1 represent solution compositions, and X2 and X1 represent the respective system compositions, at convenient points on the second straight line (BC).
FIG. 3. TYPICAL PHASE SOLUBILITY DIAGRAM
The point B in the diagram represents the system where the main component or, in rare cases, the least soluble of the components of the test substance has reached the limit of its solubility. The solubility of this component is obtained by extending the solubility line (BC) through the Y axis. The point of interception on the Y axis gives the solubility, in mg/g, which should be constant for a given compound.
At point C in the diagram the next component of the test substance has reached the limit of its solubility. The intercept obtained by extending the solubility line (CD) through the Y axis represents the combined solubilities of the two components that have first reached their solubility limits. The solubility of the second component can thus be obtained by subtraction.
Between points D and E in the diagram the solution is saturated in respect of all components in the test substance, and its composition remains constant.
Under appropriate conditions the number of impurities present in the test substance is shown by the number of inflexions of the solubility curve above the first saturation point (B) and the solubilities of the respective components can be obtained in a way similar to that described above.